

Insight X
A brand, website and AI analytics product that turn medical spa data into clear next steps.
- Industry
- AI analytics for medical spas
- Services
- Brand identity, Website, Dashboard
- Result
- $250K round closed
The brief
Medical spa owners sit on revenue, booking and staff data spread across QuickBooks, CRMs and spreadsheets, but few have time to make sense of it. Insight X set out to fix that with AI that cleans the data, spots what is working and says what to do next. It needed a brand that felt credible to investors and owners, a website that explained the product in seconds, and a product people could read at a glance.
What we did. Step by step.
- 01
A sharp, confident identity
The wordmark pairs a heavy, friendly sans with a chevron X whose lower half is cut out in teal, a nod to finding the insight hidden in the data. Deep navy and signal teal on warm cream keep it calm, clinical and easy to trust.

Logo on the brand gradient: deep navy and signal teal - 02
A website that sells the outcome
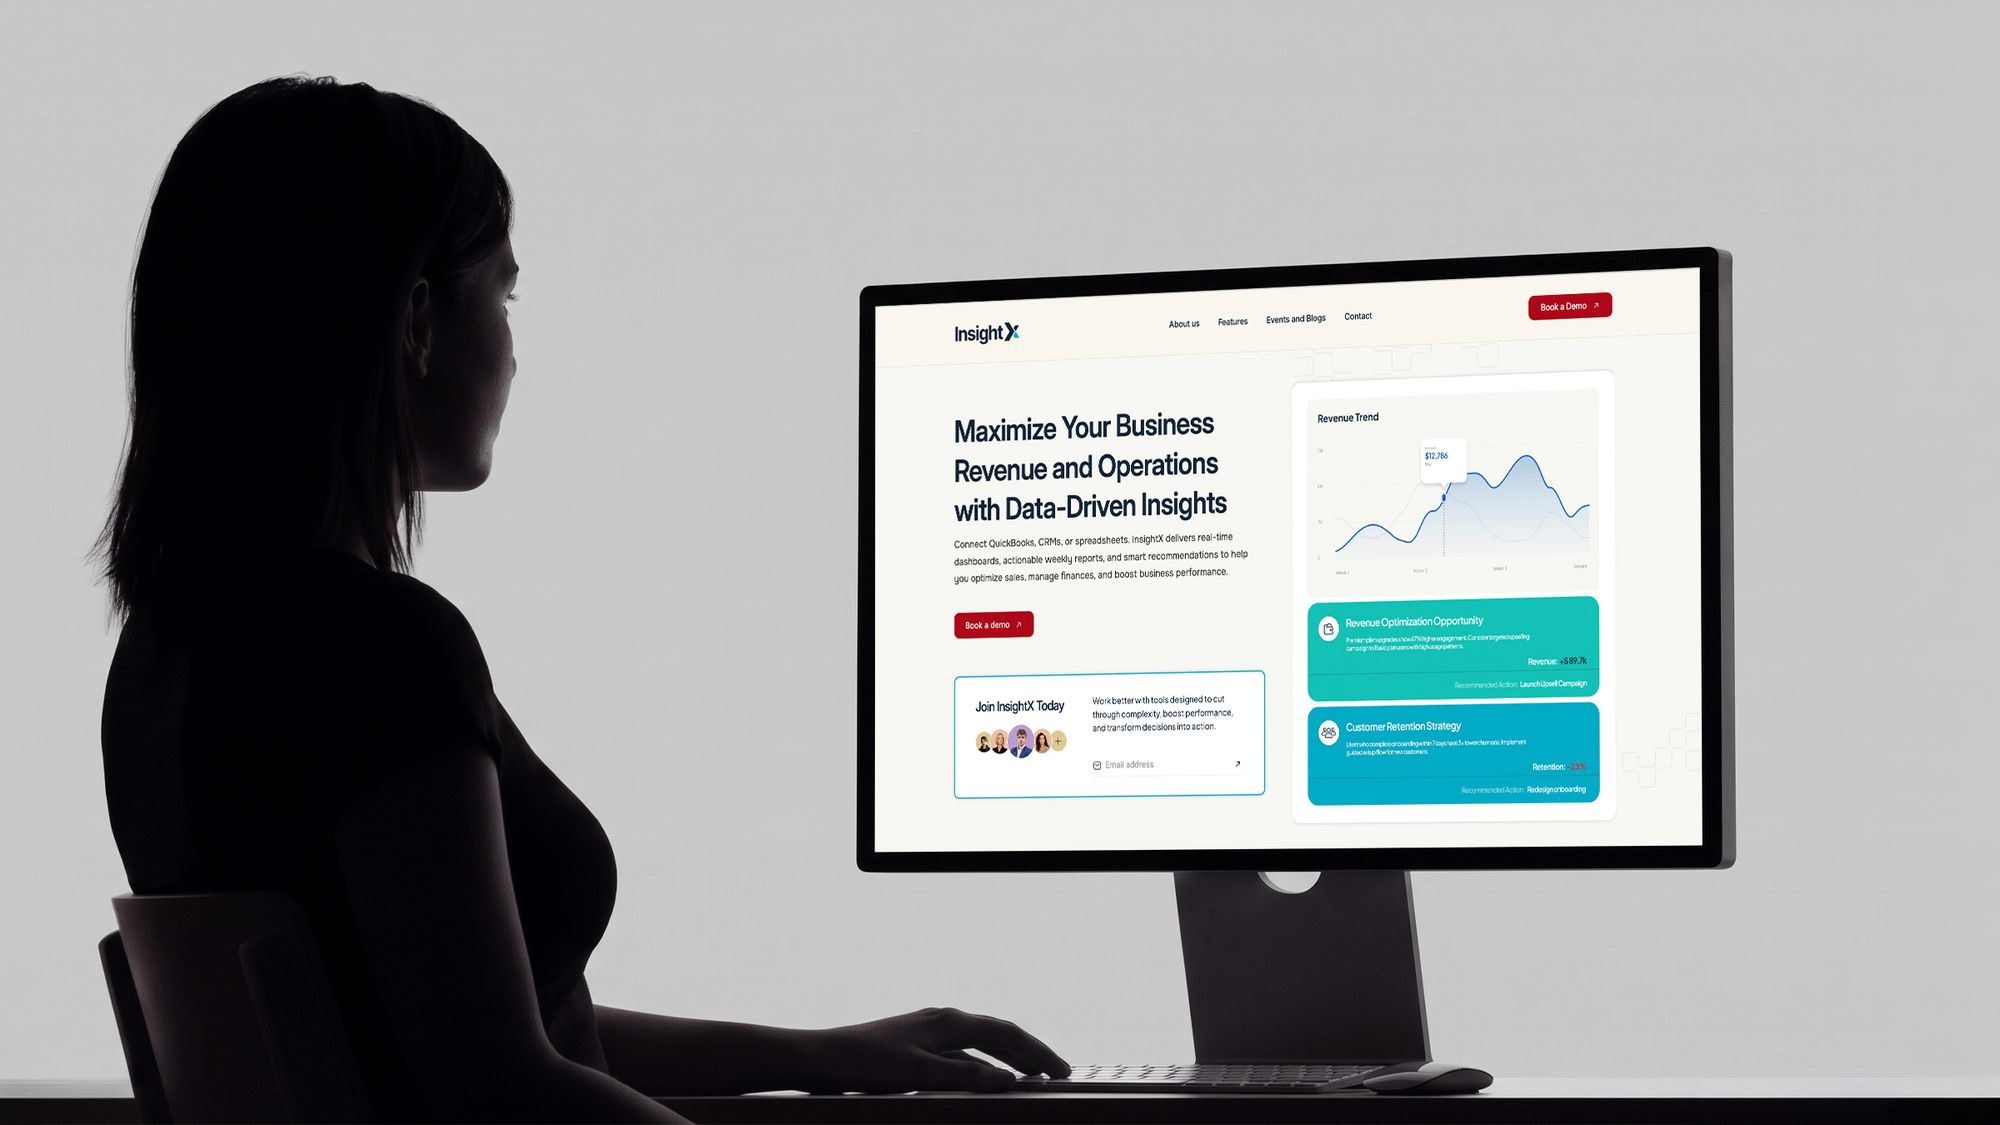
The homepage leads with "Maximize Your Business Revenue and Operations with Data-Driven Insights" and shows the product right away: a live revenue trend and the AI insight cards. The copy explains the promise in three steps: connect QuickBooks, CRMs or spreadsheets, let Insight X do the work, and get actionable reports every week.
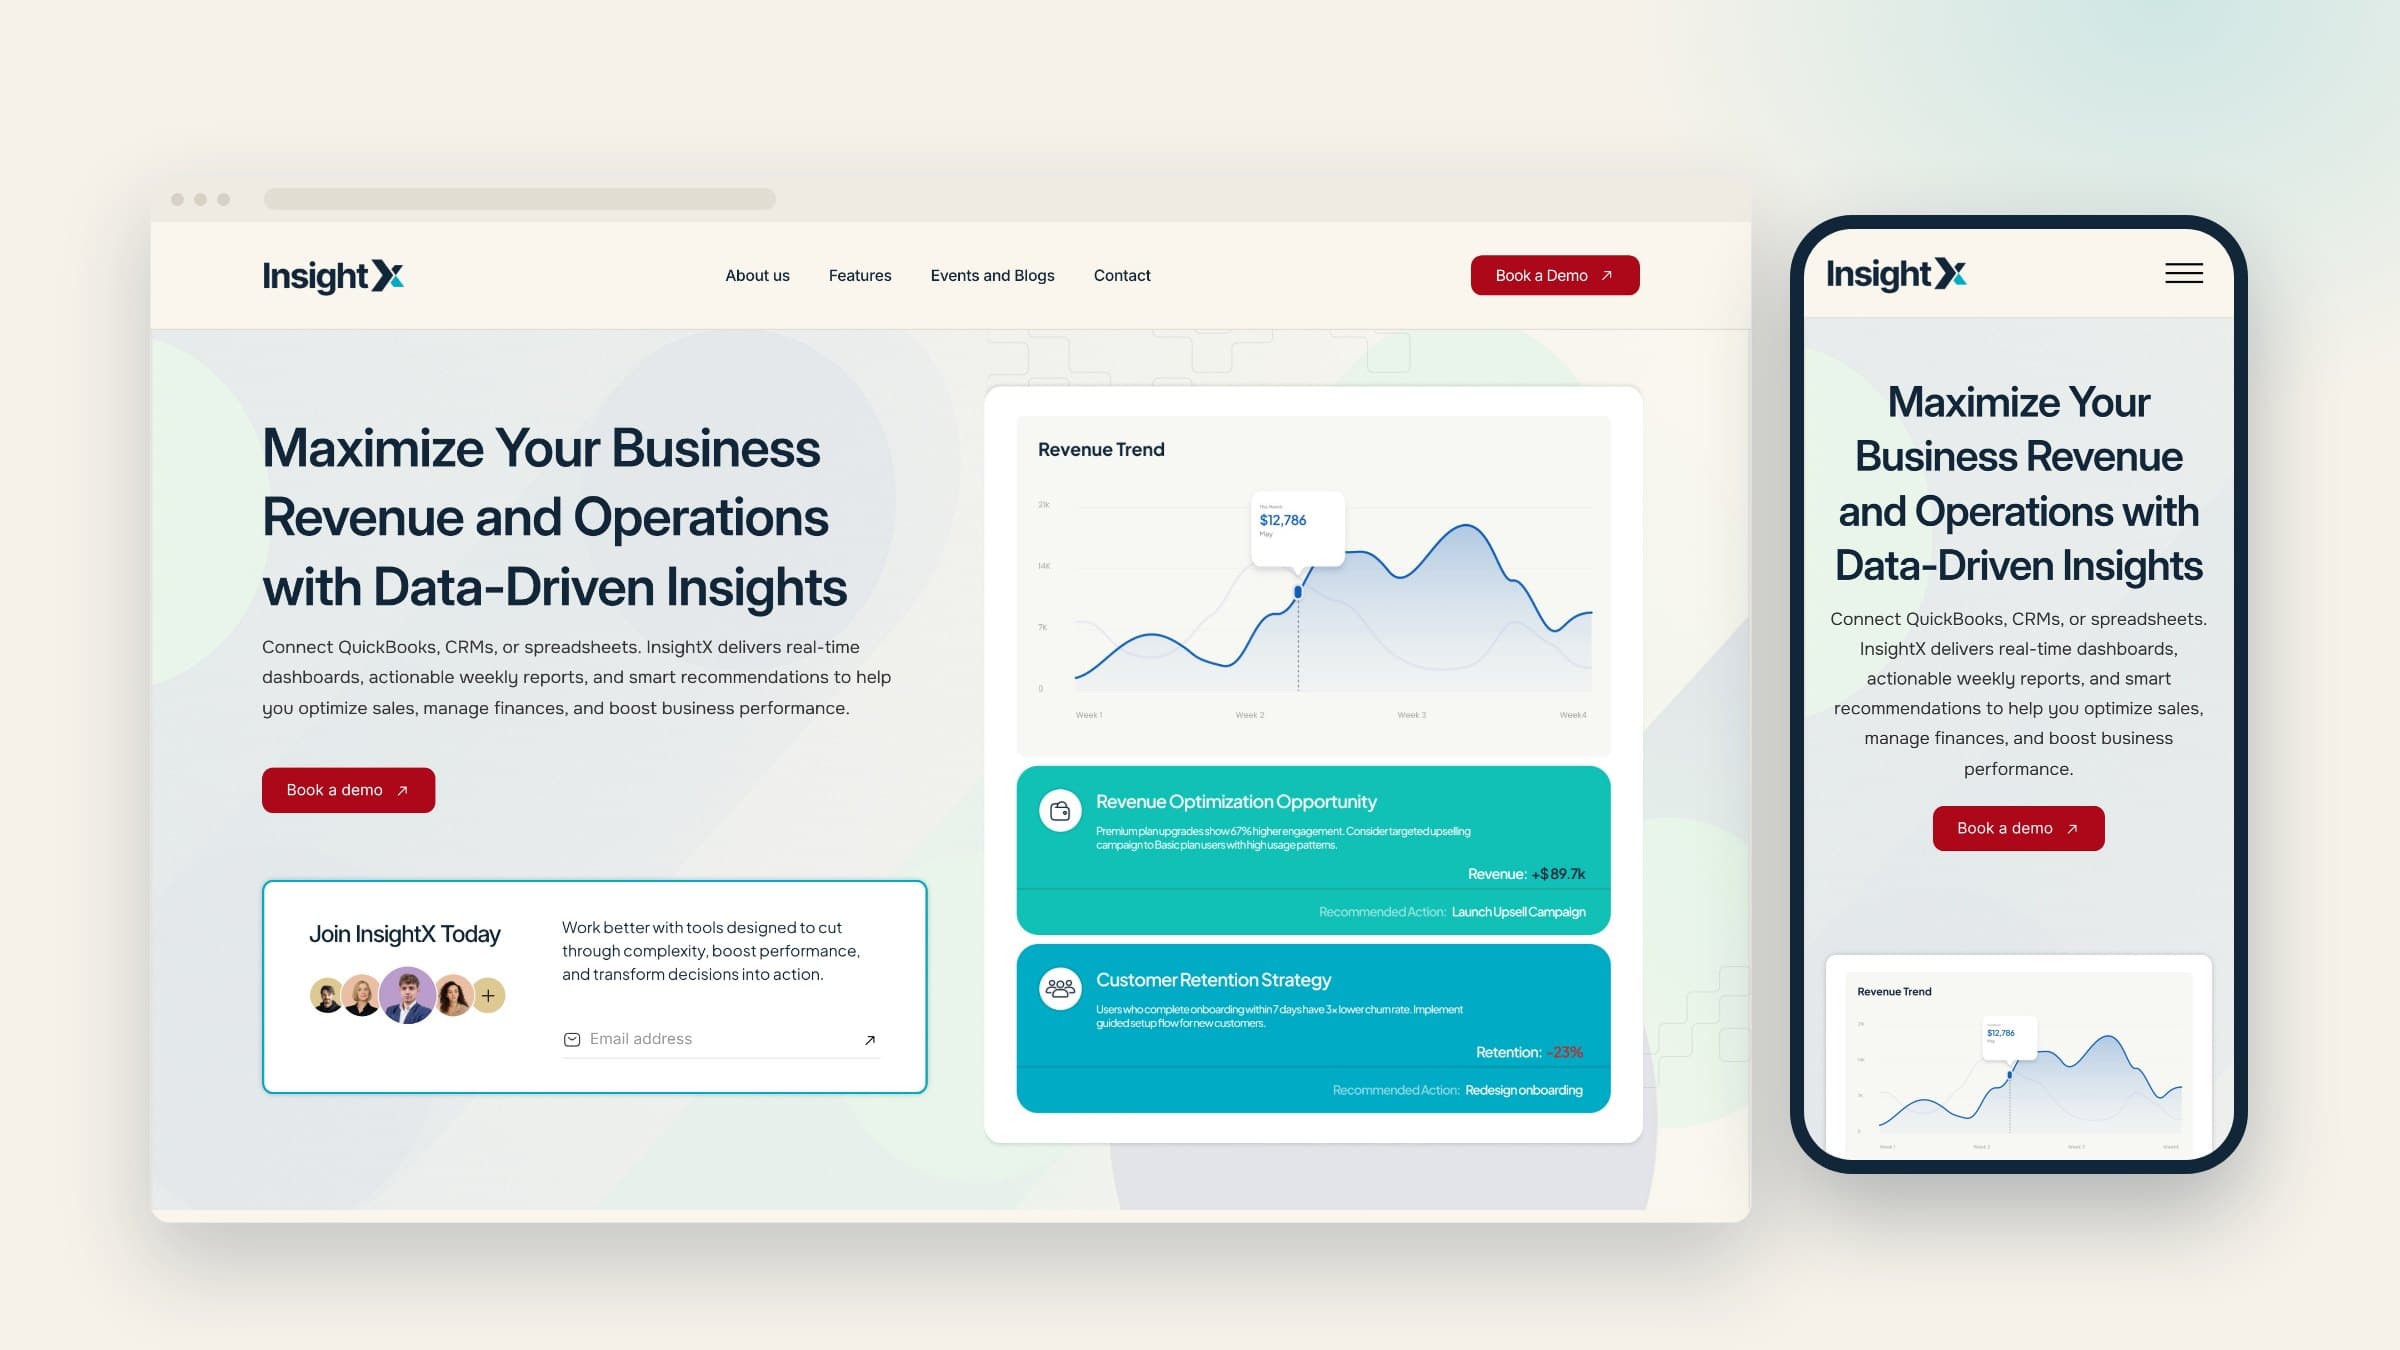
Homepage on desktop and mobile 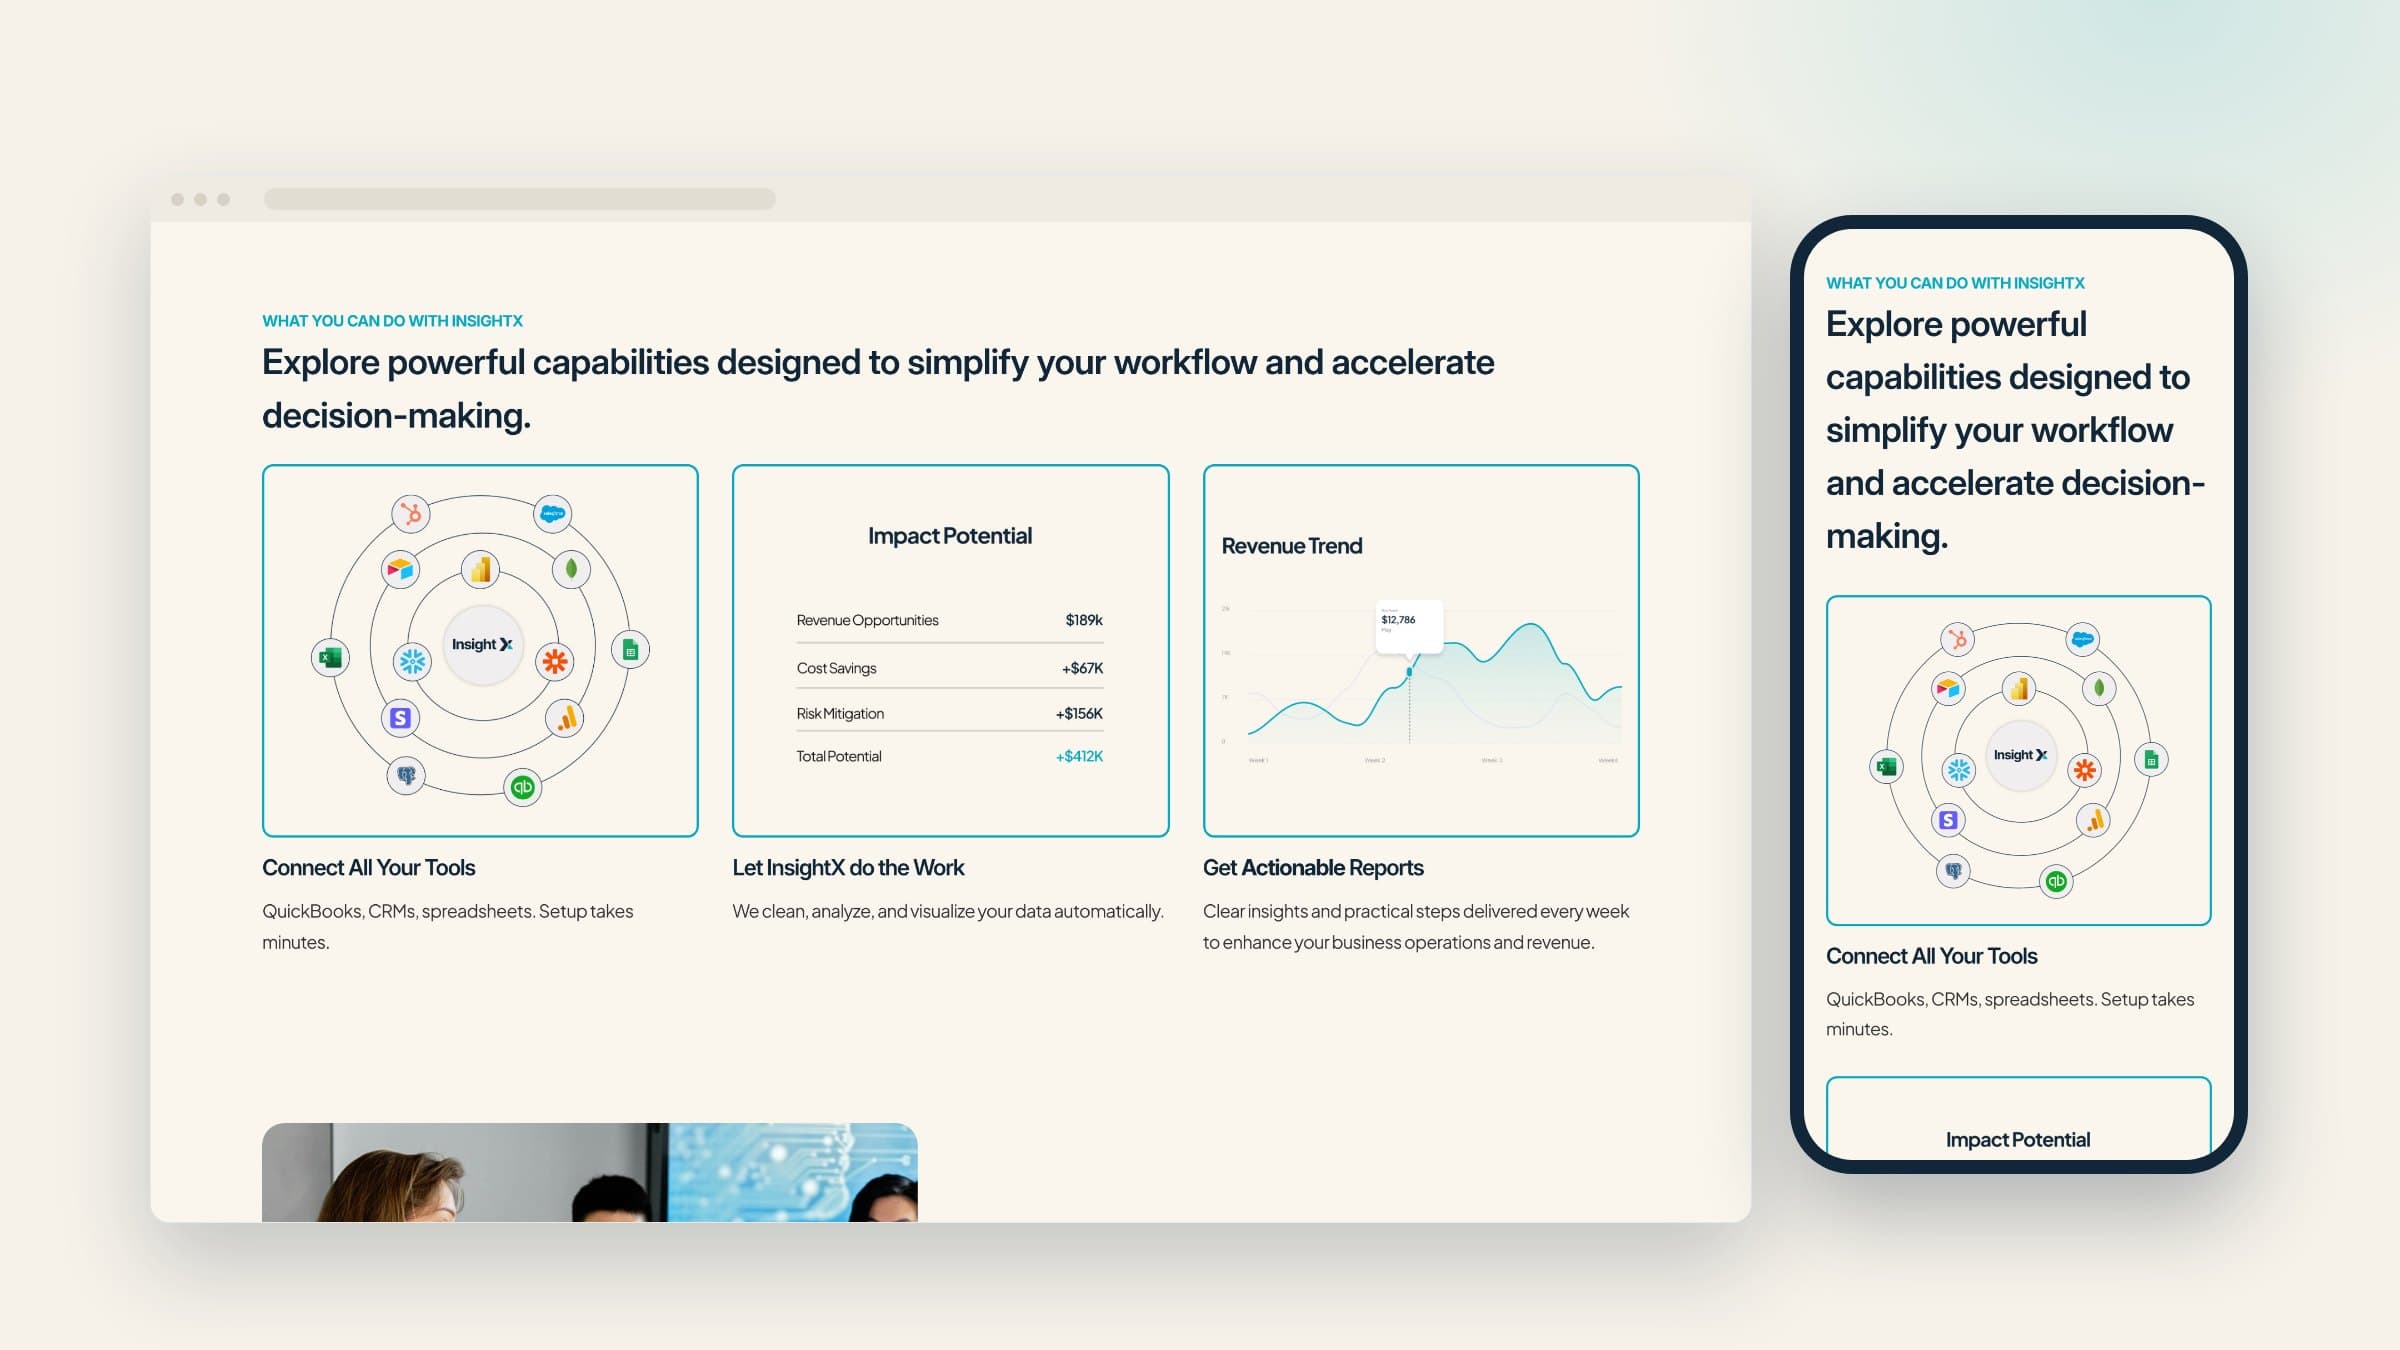
How it works, on desktop and mobile - 03
A dashboard owners read in seconds
The overview greets the owner by name and answers the big questions first: revenue, bookings, average ticket and cancellations, each with a trend line. Below them sit a year of revenue, the treatment mix, today's appointments and the week's top AI insight with one button to act on it.
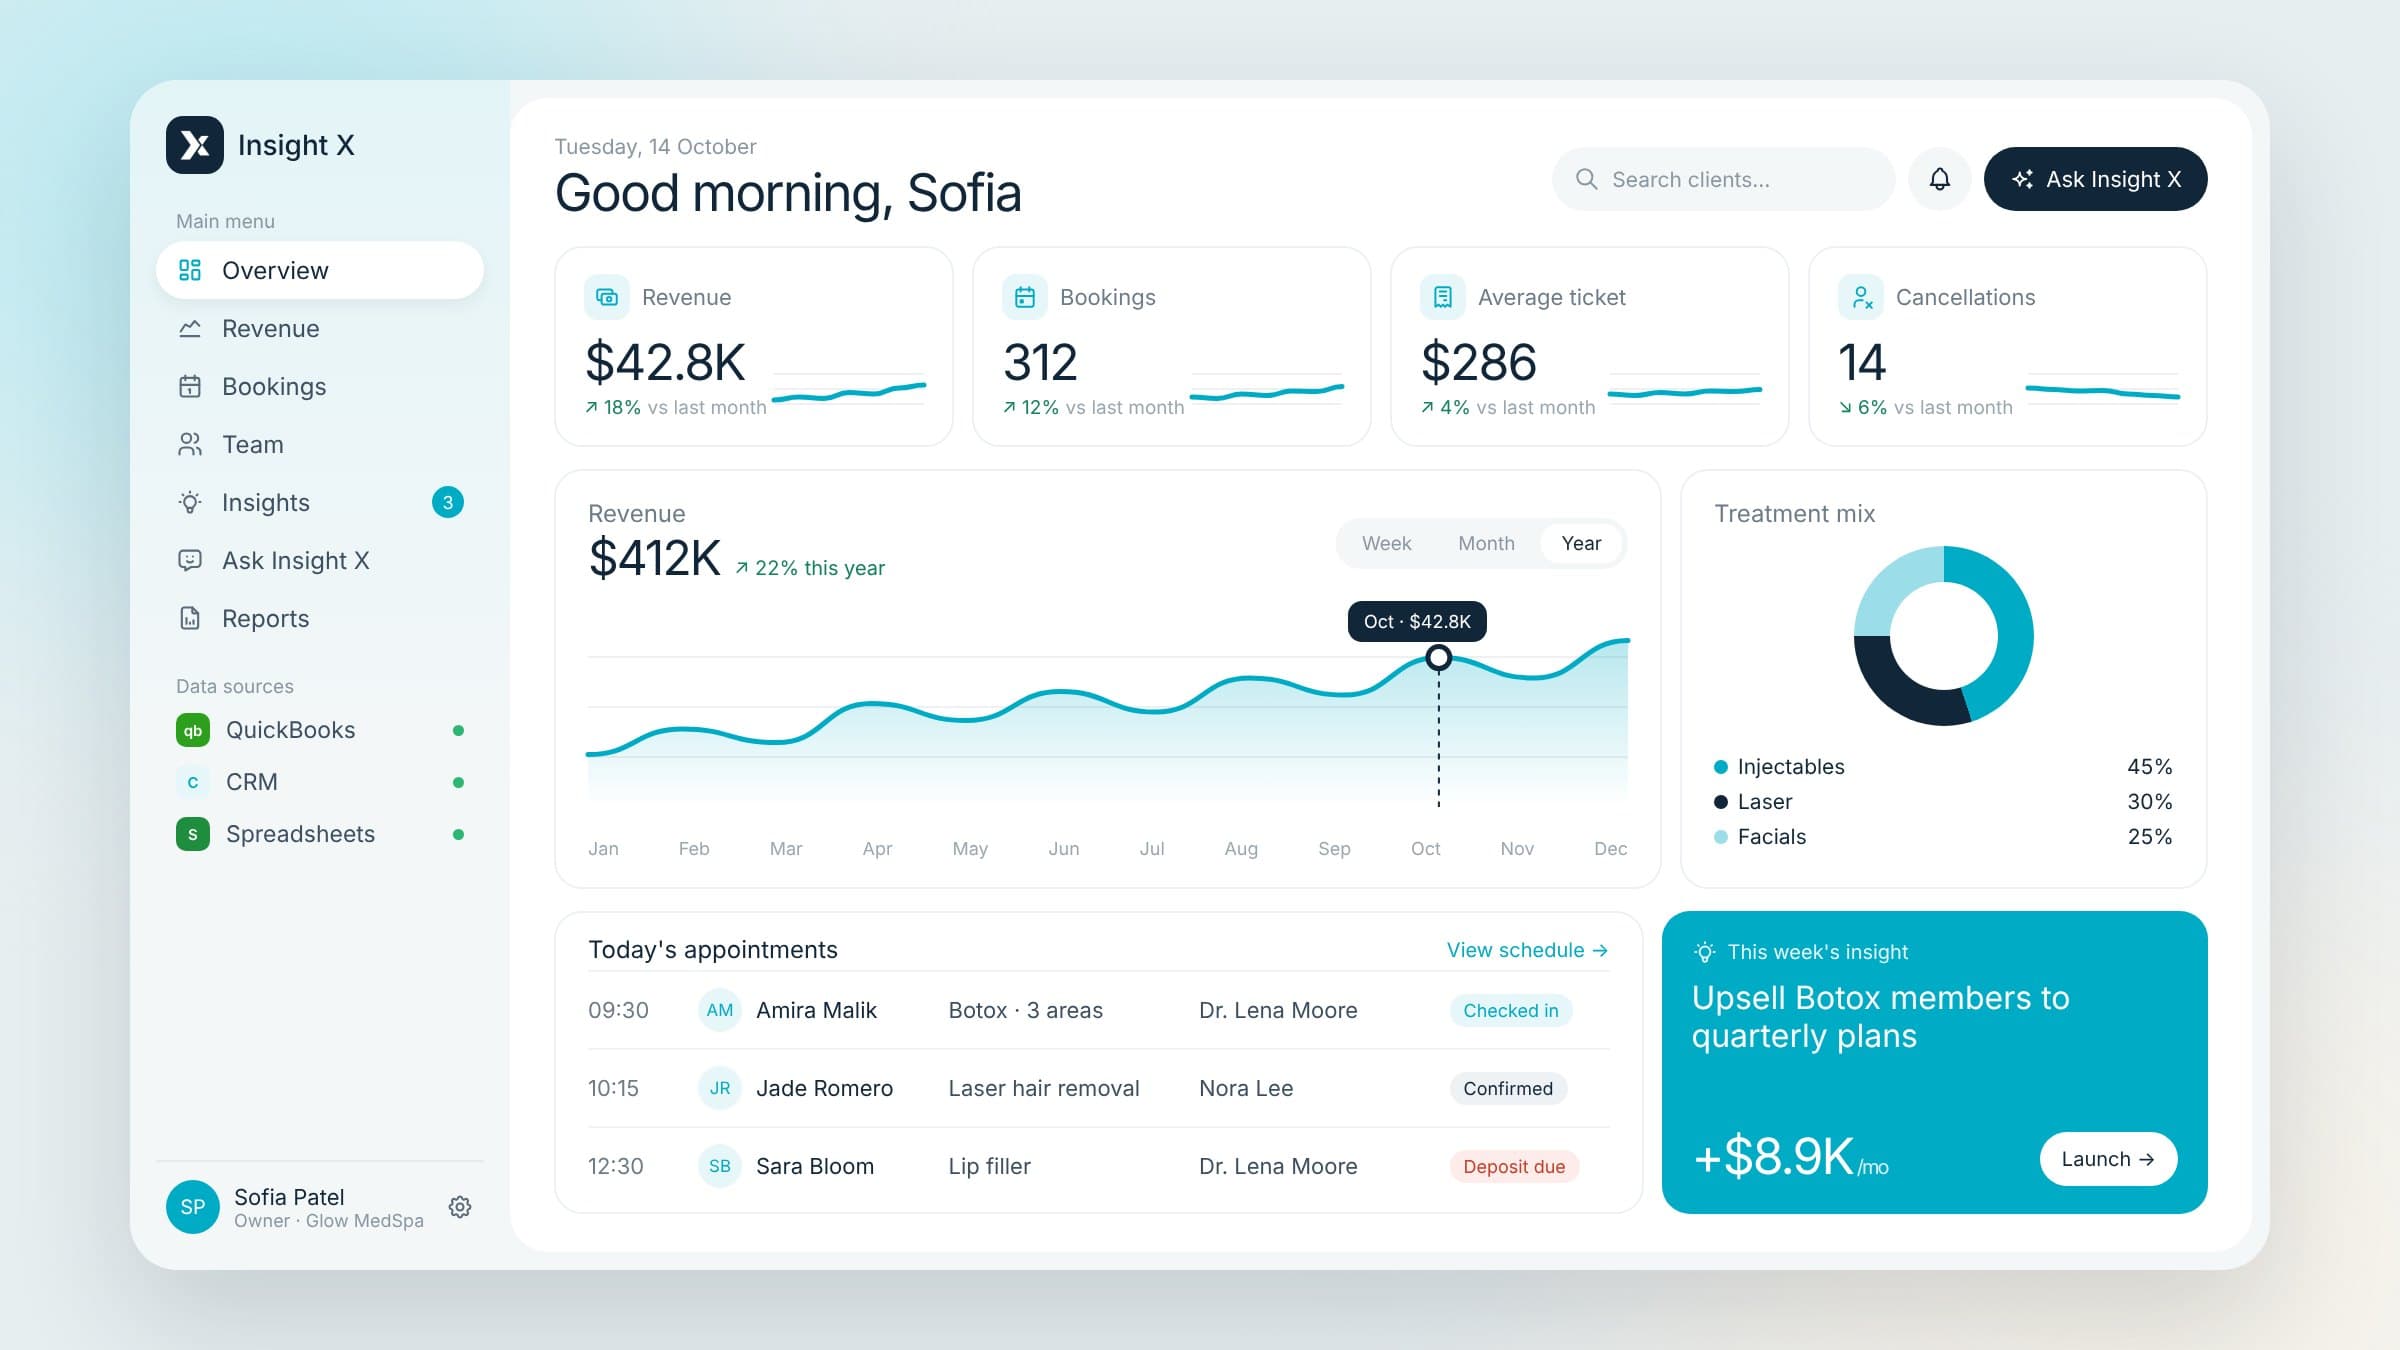
Overview dashboard - 04
AI insights with a price tag
The insights view turns analysis into a short to-do list. Each recommendation, like upselling Botox members or rebooking laser clients at six weeks, carries a monthly value, and they add up to one impact number for the quarter. Smaller cards track the membership goal, retention, cancellations, the next best action and the top provider.
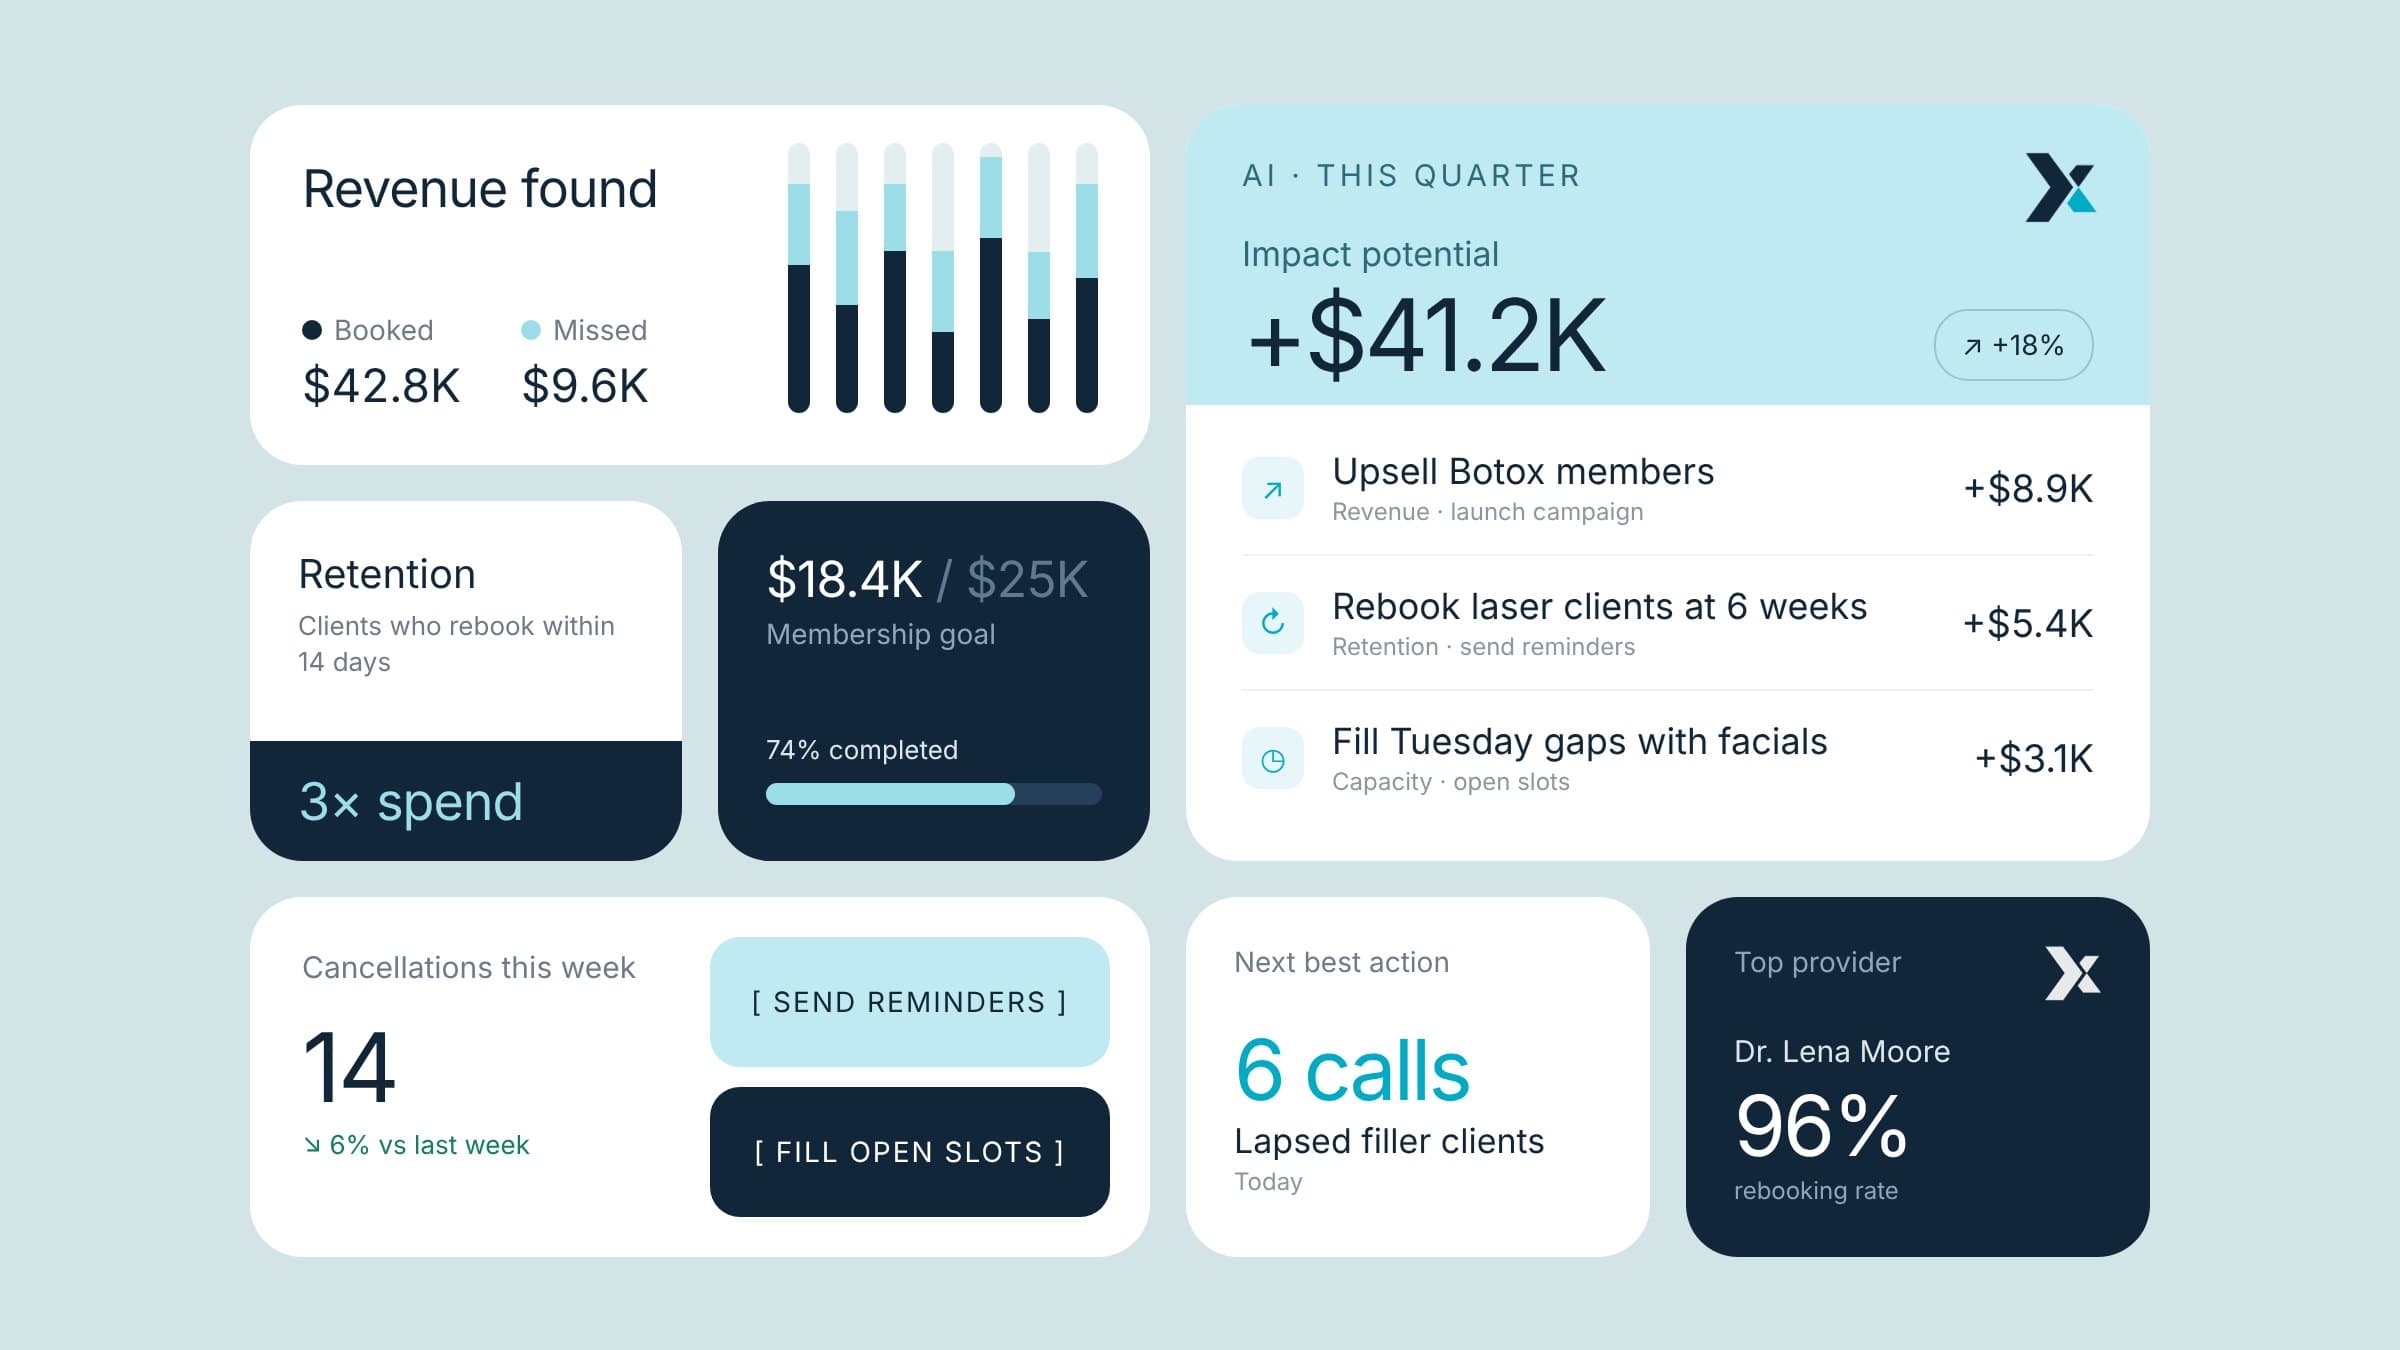
AI insights and impact potential - 05
The numbers owners check every day
The metrics view puts every number that matters on one screen: monthly revenue, bookings by day of the week, the treatment mix, rebooking rate, average ticket, cancellations and revenue by provider. Big figures and simple charts make it readable in a few seconds, even on a busy clinic day.
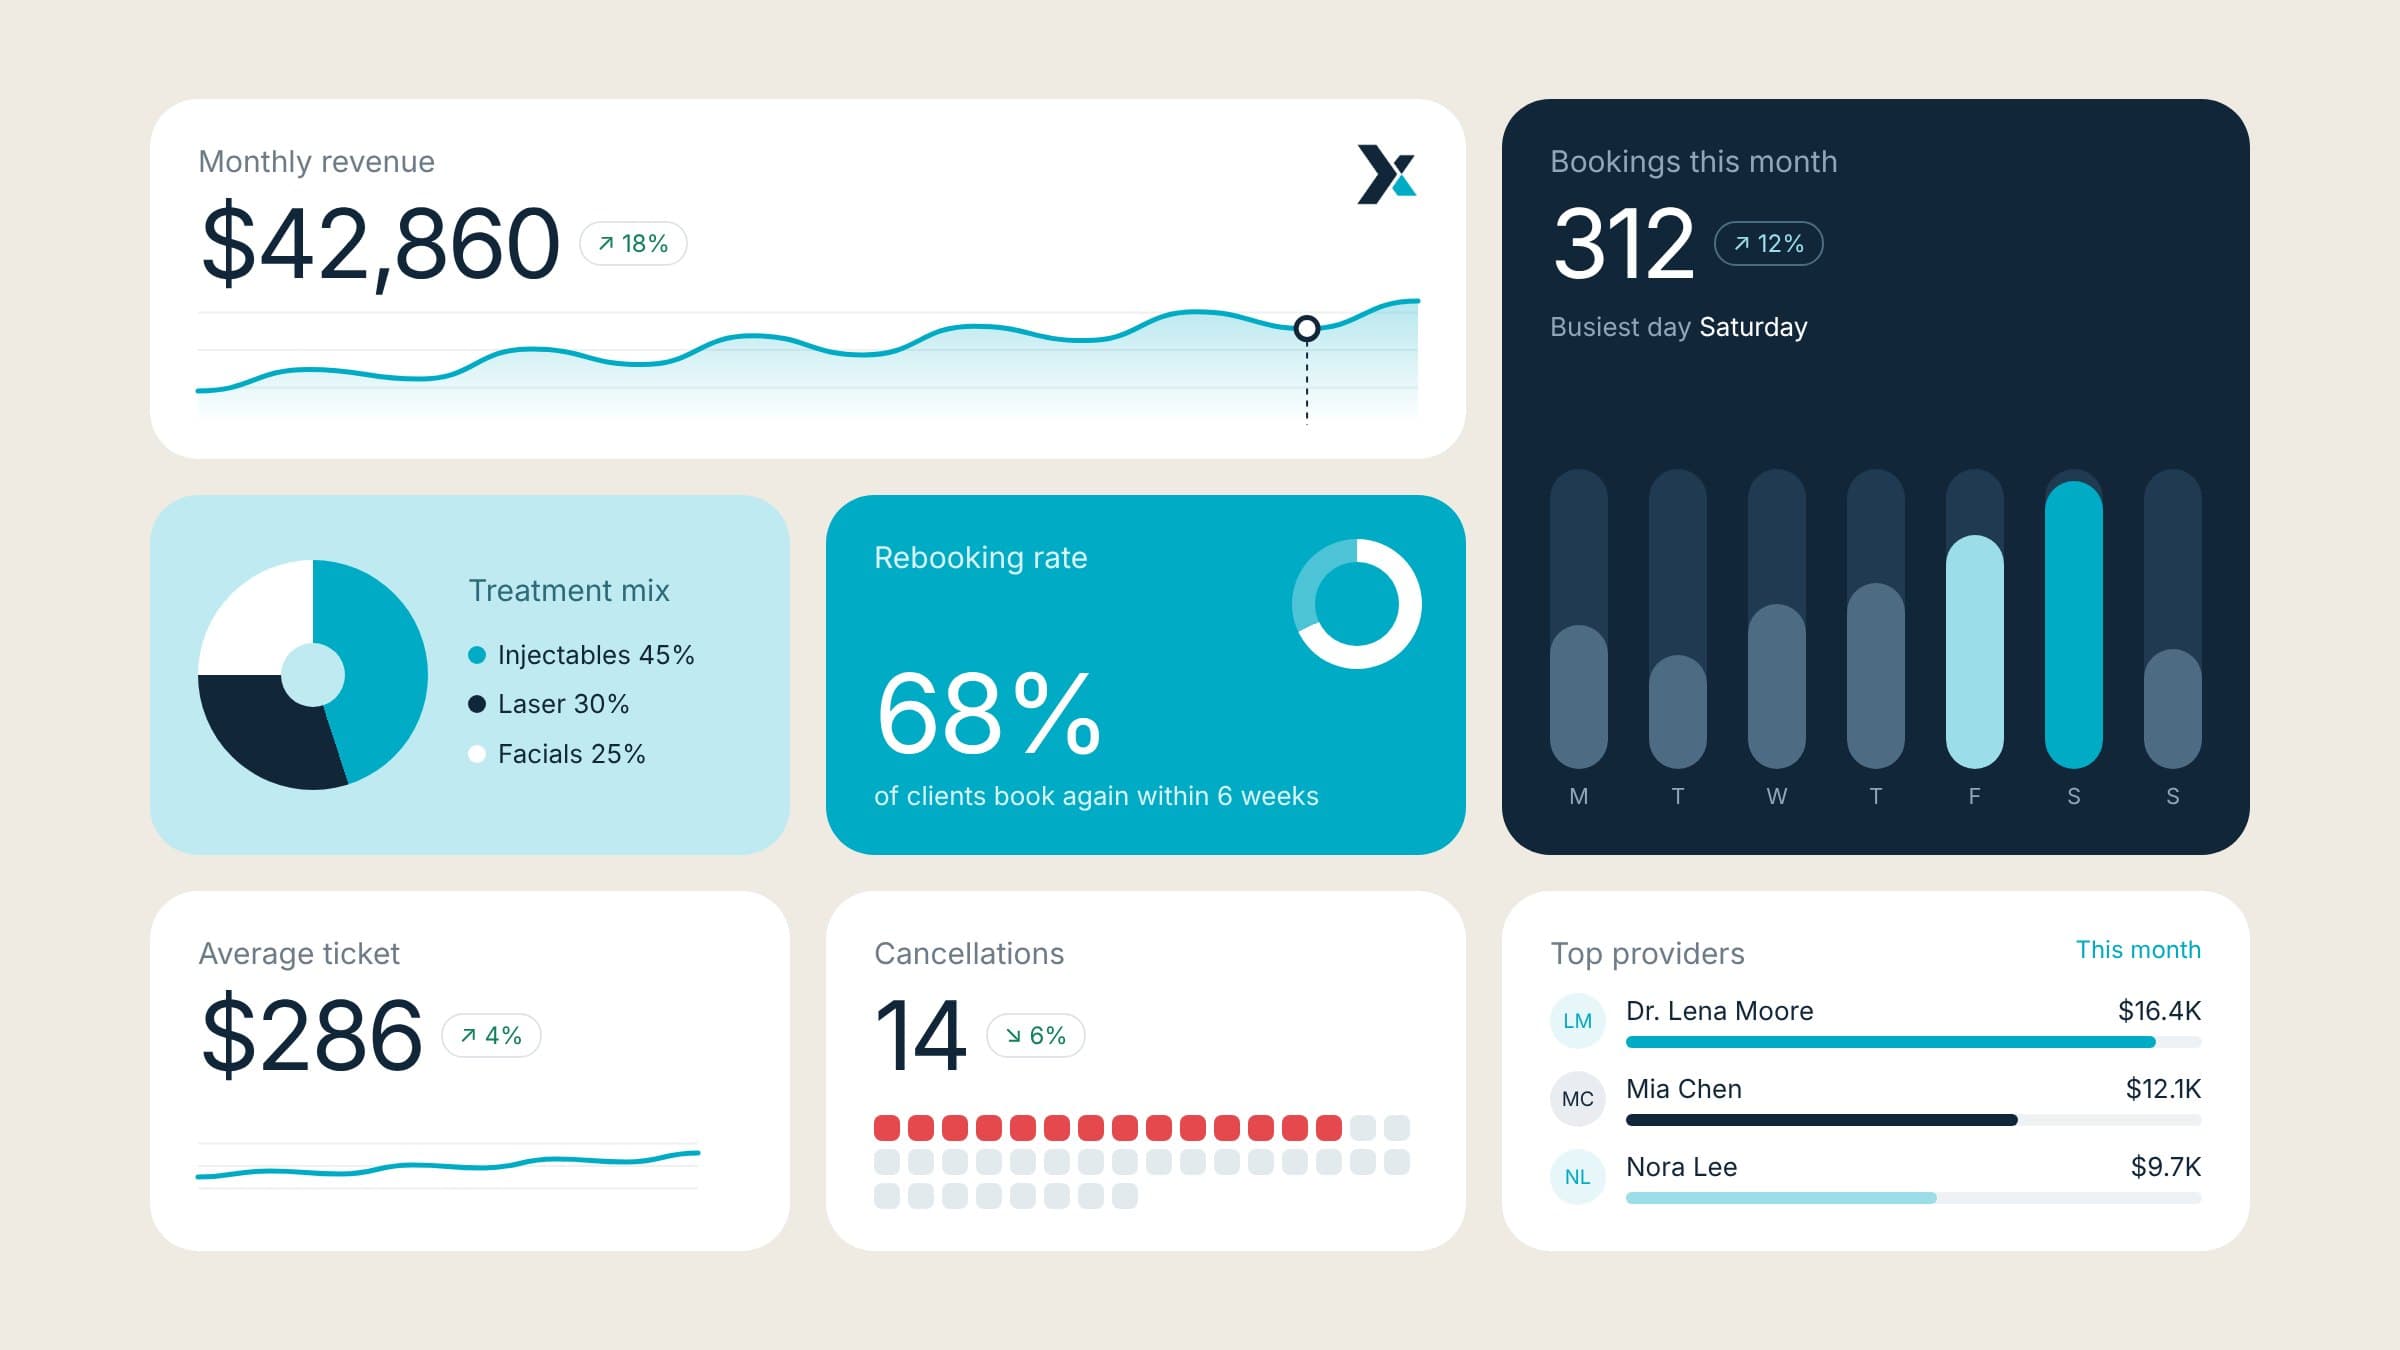
Key metrics at a glance
The result. What it delivered.
Insight X launched with one connected system: a brand, a website and a product that look and speak the same way. With the product designed end to end, the team went on to close a $250K funding round.
- Funding round closed
- $250K
- Data sources: QuickBooks, CRMs and spreadsheets
- 3
- Core screens: overview, metrics and insights
- 3